
What the 2026 NAB Show Reveals About Where Sports Media Is Heading: AI at Scale, Rights Economics, and the End of the Proof-of-Concept Era
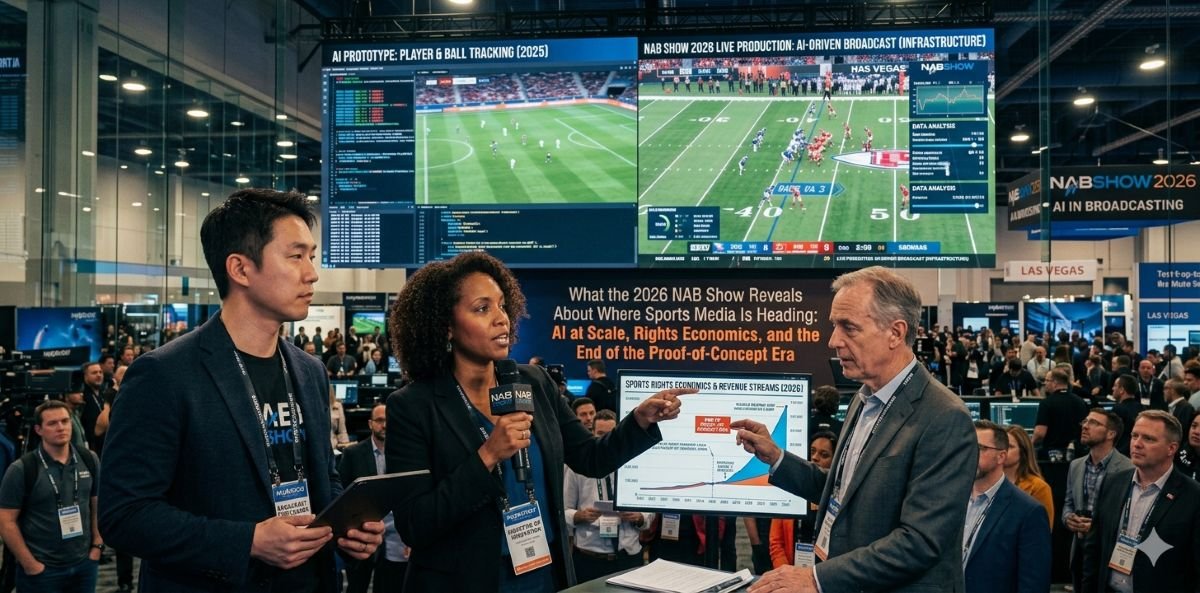
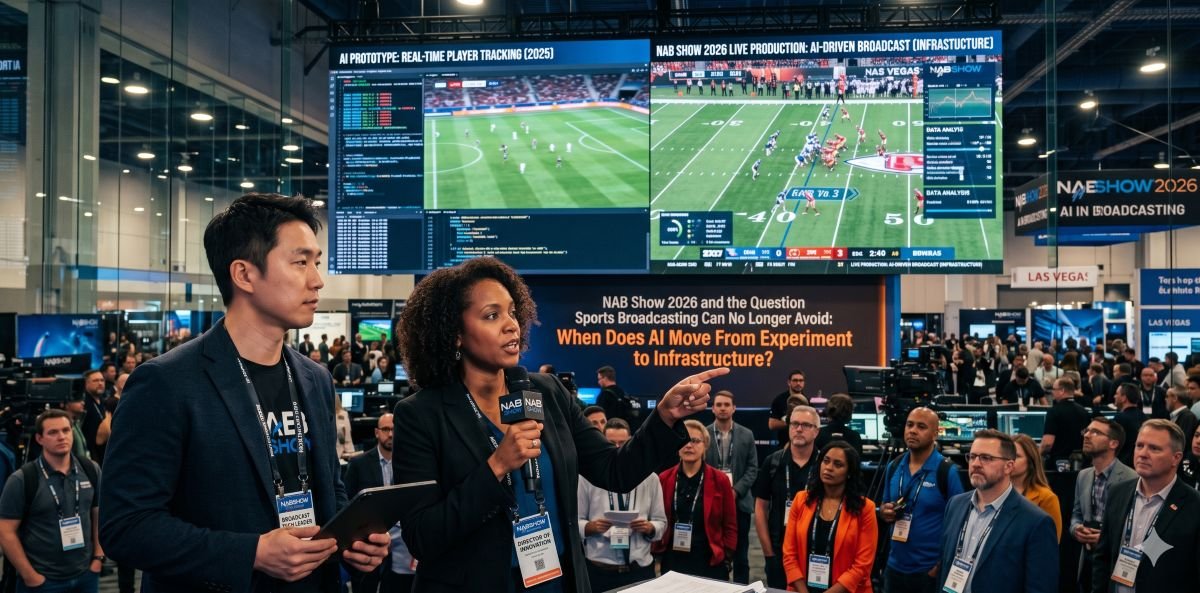
The 2026 NAB Show opens in Las Vegas on April 18, and the industry arriving there is measurably different from the one that attended five years ago. The questions that dominated those earlier gatherings — does cloud production work, can AI be trusted in live environments, is streaming a viable business model — have largely been answered. What replaces them is harder: how do you make all of it function reliably, at scale, under real operational conditions, with budgets and production teams that have not expanded to match the demands placed on them?
That is the organizing pressure behind the conference agenda, and it runs through every segment of the sports media industry in particular.
The Industry Has Moved From Experimentation to Execution
The framing that the National Association of Broadcasters has placed at the center of this year’s show is deliberately unsentimental. Karen Chupka, executive vice president of Global Connections and Events at NAB, described the moment plainly: the biggest shifts in media are no longer theoretical — they are happening in real time across how content is created, distributed and monetized.
This is not a marketing claim. It reflects a structural reality that the industry’s own production infrastructure has had to absorb. Steph Lone, AWS’s global leader for solutions architecture in media, entertainment, games and sports, put the technical dimension of the same problem in concrete terms: the most significant shift at the 2026 show is the convergence of compression, delivery, and machine intelligence into unified workflows. Traditional formats were built for human perception, not machine analysis — and the cost of that mismatch is now measurable. Accelerators sit idle 30 to 60% of the time waiting for properly structured data, while pipelines decode entire frames only to discard more than 99% of the pixels.
The exhibit floor reflects the scale of this transition. NAB Show 2026 features nearly double the number of AI exhibitors compared to 2025, with AWS, Adobe, Microsoft, NVIDIA, and Google Cloud all demonstrating where AI is now embedded across the full content lifecycle — from production and post-production through distribution, metadata management, and audience personalization.
Sports Rights Economics Are Changing at the Same Moment
Alongside the workflow conversation, the show’s expanded Sports Summit — now running for four full days — is addressing a parallel shift in the business structures that govern how live sports reaches audiences. This is the dimension of the NAB agenda that connects most directly to how platforms like TVING and SOOP in Korea operate, because the economic pressures reshaping rights in North America flow through the same global dynamics affecting every streaming-first sports distribution model.
The core tension is this: live sports remains the most valuable content asset in media, but the structures of ownership, rights negotiation, and distribution have fragmented significantly. Leagues, teams, and individual athletes are increasingly acting as their own media companies, using technology to reach audiences directly rather than routing exclusively through traditional broadcast partners. Private equity and sovereign investment funds have entered the market with different ownership expectations and timelines than traditional broadcasters. And audiences are not concentrated on a single platform in the way that made rights exclusivity so commercially powerful a decade ago.
As analyzed in how SOOP and CHZZK divided the Korean live sports streaming market and what the LCK rights deal reveals about platform strategy, the Korean streaming environment is navigating precisely this territory. When a rights deal moves from a legacy broadcaster to a platform-native streamer, the entire audience discovery and retention infrastructure has to be rebuilt around a different set of user behaviors. The NAB Sports Summit discussions — centering on media rights strategy, direct-to-consumer models, and how investment structures shape distribution decisions — provide the global framework within which those Korean platform decisions are happening.
Jon Miller, president of acquisitions and partnerships for NBC Sports, will headline the Sports Summit’s flagship session on rights, partnerships, and the future of distribution. The discussion is positioned as a critical-moment conversation: the rights structures that defined the previous decade of sports broadcasting are being renegotiated in real time, and the outcomes will determine what viewers can access, on what platforms, and at what cost.
Why the Production Conversation and the Rights Conversation Are Connected
The separation between “technology” discussions and “business” discussions at industry events like NAB has always been somewhat artificial. In 2026, the connection is more explicit than usual, because the production infrastructure decisions being made now directly determine what business models are viable later.
The convergence Lone describes — compression, delivery, and machine intelligence operating as a unified workflow rather than a sequential pipeline — is not just an efficiency story. It is the technical foundation that makes direct-to-consumer distribution economically viable for smaller sports properties. A league or federation that could not previously afford the production and distribution overhead required to reach a global audience can now, through cloud-native and AI-assisted workflows, produce broadcast-quality content at a fraction of the previous cost.
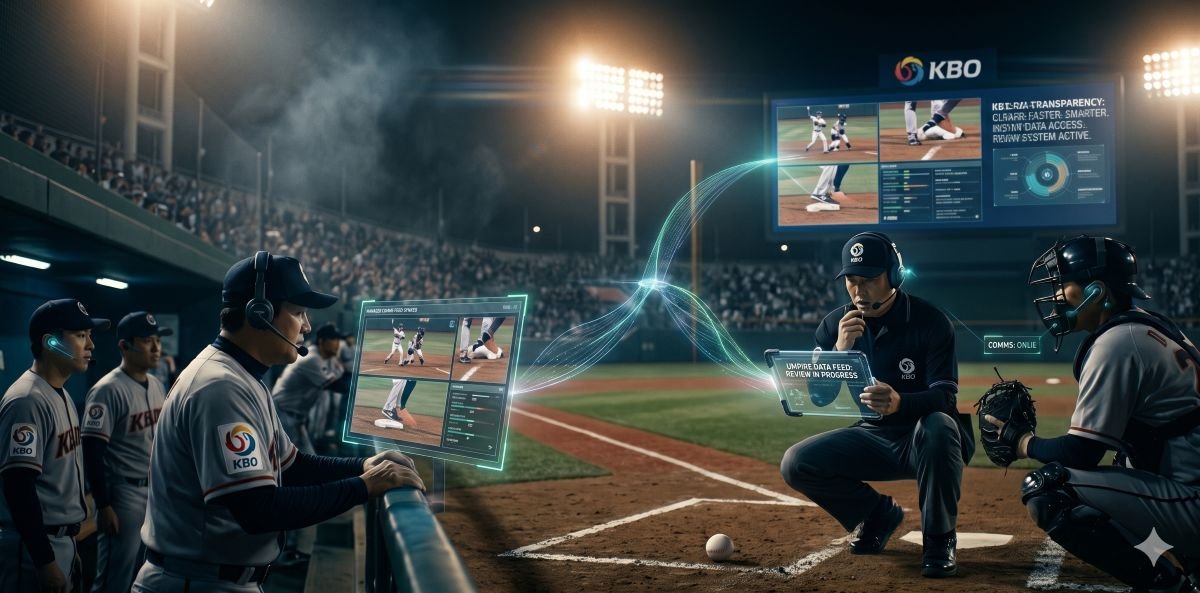
This matters for the Korean market specifically. The ability of KBO and K League content to reach Korean diaspora audiences internationally, or for women’s volleyball and basketball leagues to sustain streaming distribution without requiring legacy broadcast partnerships, depends on exactly the infrastructure being demonstrated on the NAB Show floor.
The Scale Problem Is the Real Story
The broadcast and media industry at NAB 2026 is not short of technology. It has more tools, more capable infrastructure, and more AI integration than at any previous point in its history. What it is working through is the harder problem of operating all of it at scale, sustaining it financially, and governing it responsibly under real-world conditions.
That is the conversation the 2026 show is organized around, and it is the same conversation that every sports media organization — from global broadcasters to Korean streaming platforms to regional leagues trying to build digital audiences — is having simultaneously. The proof-of-concept era is over. The execution era has its own, more demanding set of questions.